Verdict
Why Accuracy Is High
不是神奇预测,而是早盘状态已经包含很多当天信息。 这里的 raw direction test 只问一个简单问题:开盘后 30/60/120 分钟的方向,能不能判断当天收盘相对开盘是涨还是跌。QQQ 这种高流动性指数 ETF 在开盘后会快速消化隔夜信息、宏观新闻、期权 gamma/hedging flow 和机构订单,因此早盘方向经常会延续到收盘。
速度快的原因也很直接。 模型不是深度学习,也不需要逐笔 order book。每天只生成一行特征:early return、early range、VWAP gap、gap、ATR、以及相对前几天支撑/阻力位的距离。walk-forward 部分用 logistic regression,样本只有 2025 年 239 个交易日,所以几秒内就能完成。
但这个准确率不能直接等价成赚钱。 120 分钟准确率更高,是因为已经观察了更多当天走势,剩余预测距离更短;而 vertical spread 的价格会把一部分概率优势提前计入 premium。当前主规则的 modeled vertical PnL 仍然为负,说明需要真实期权 bid/ask 和严格 out-of-sample 验证。
Early Direction Signal
Support / Resistance Model
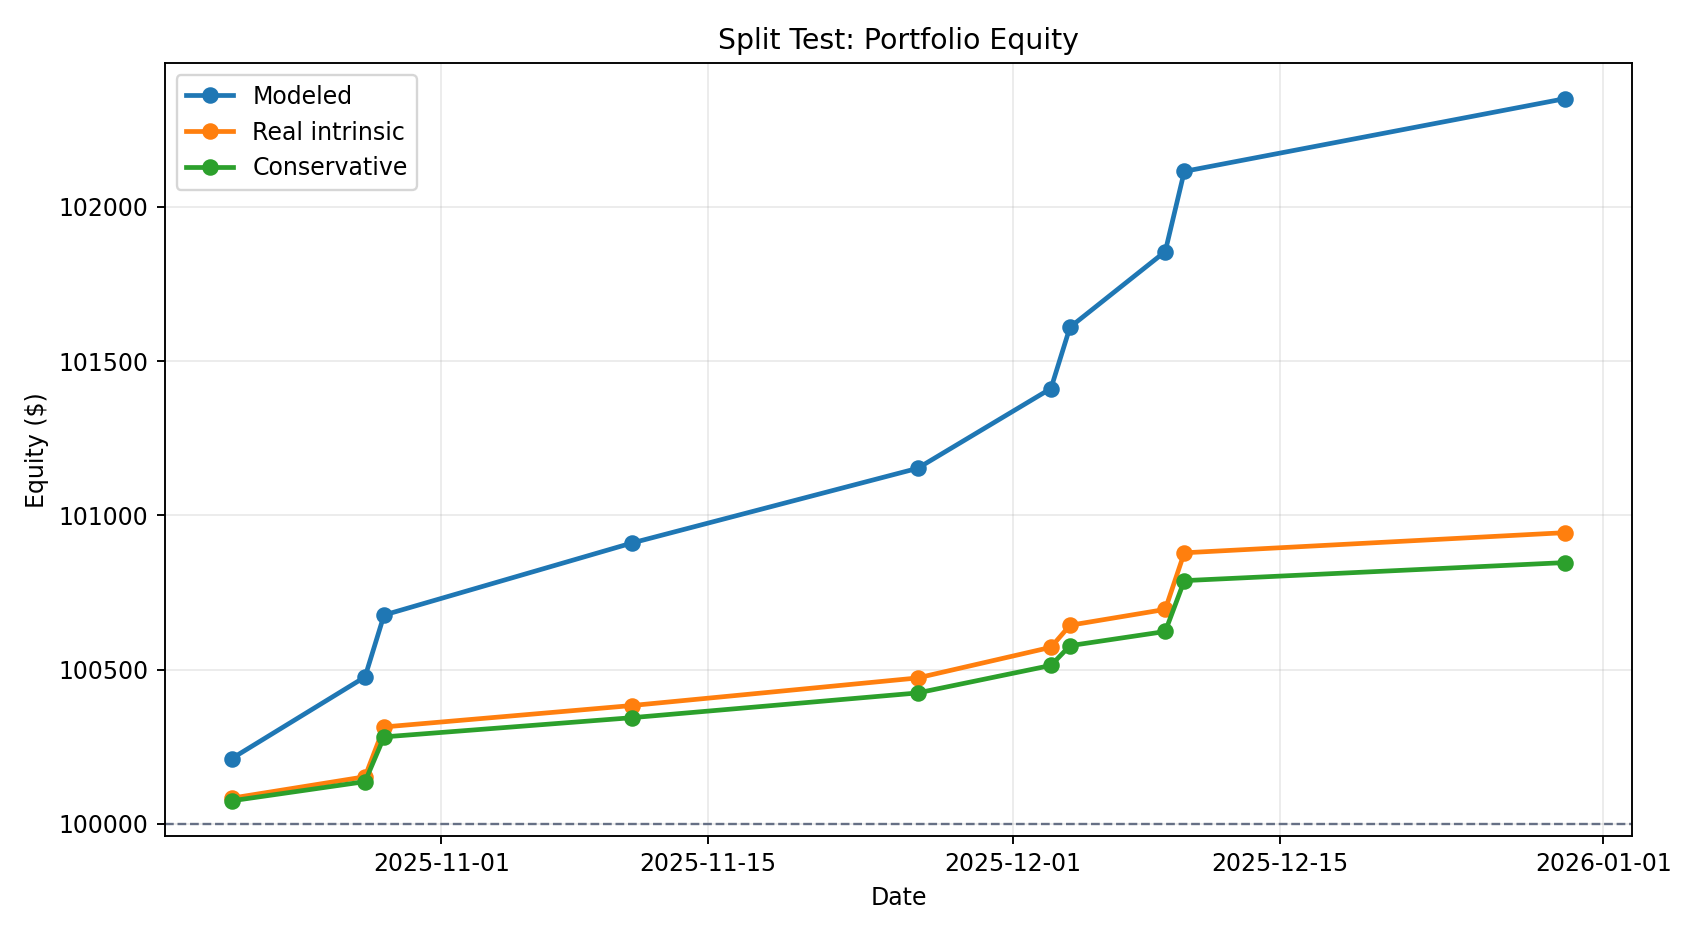
Split Test P&L
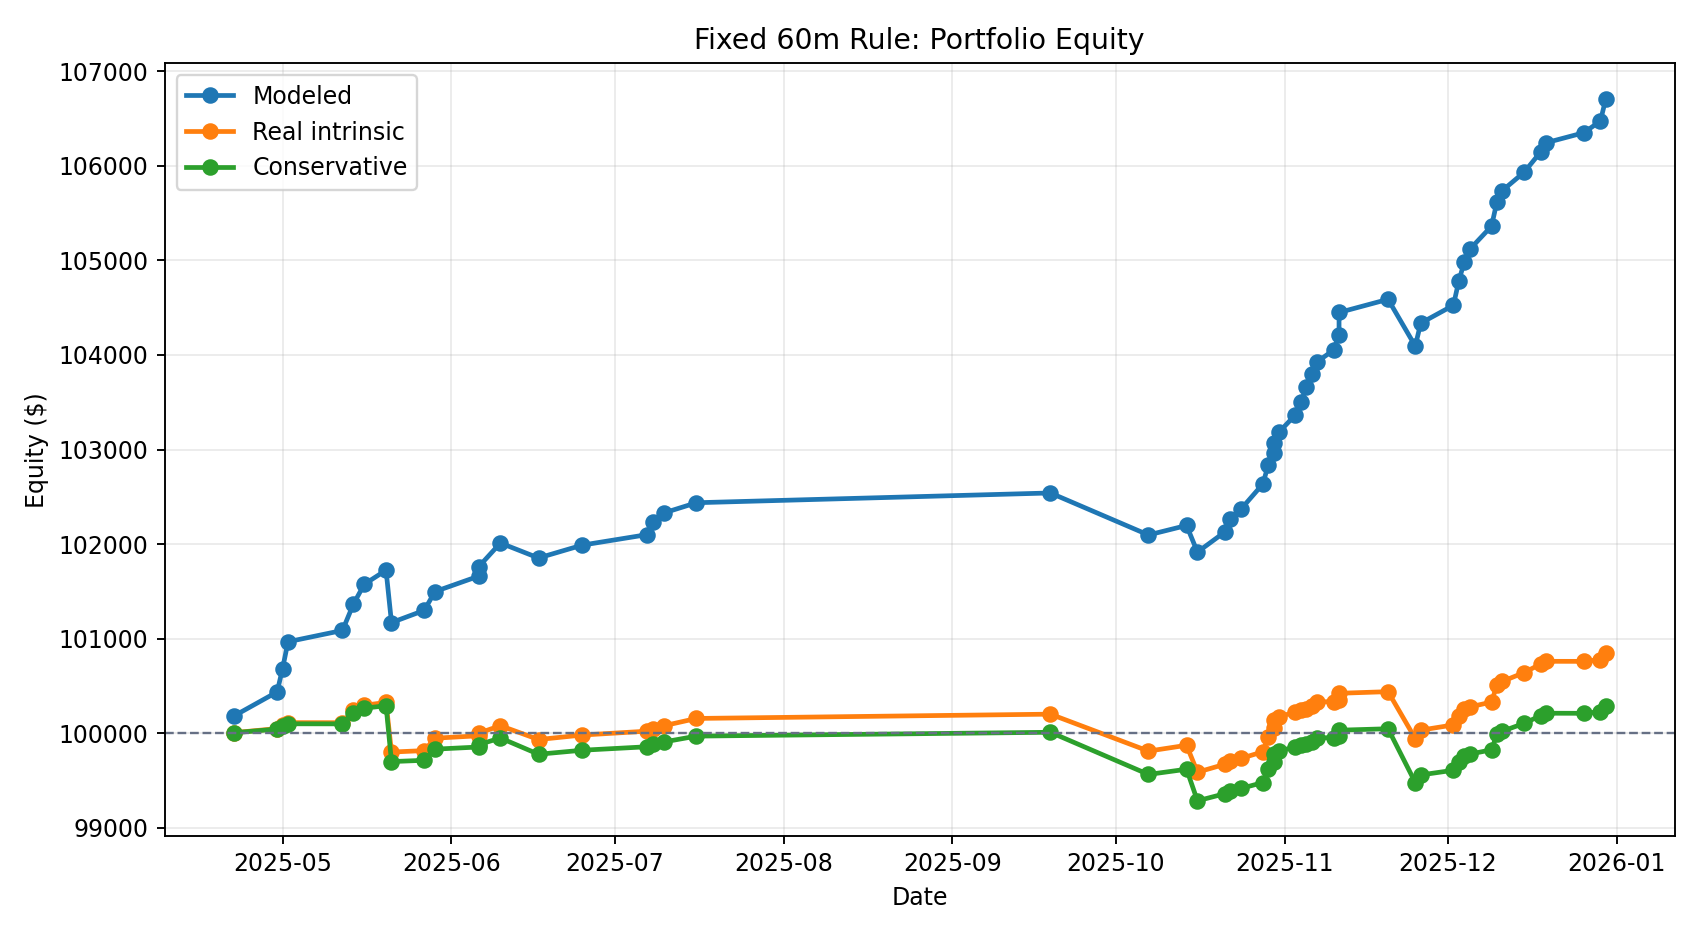
Fixed Rule P&L
Profit % And Sharpe Definition
Profit % is portfolio P&L divided by the $100,000 starting equity. It is not annualized. Sharpe is annualized from business-day returns, with zero returns on non-trade days between the first and last trade. For the 10-trade split test this statistic is fragile; the 56-trade fixed-rule sample is more informative.
| Sample | P&L Source | Trades | Portfolio PnL | Profit % | Max DD | Sharpe | Win Rate |
|---|---|---|---|---|---|---|---|
| split_test | Modeled | 10 | $2,351 | 2.4% | 0.0% | 7.72 | 100.0% |
| split_test | Real intrinsic | 10 | $944 | 0.9% | 0.0% | 6.98 | 100.0% |
| split_test | Conservative | 10 | $847 | 0.8% | 0.0% | 6.97 | 100.0% |
| fixed_60m_w5_p045_c010_030 | Modeled | 56 | $6,711 | 6.7% | -0.6% | 5.11 | 91.1% |
| fixed_60m_w5_p045_c010_030 | Real intrinsic | 56 | $844 | 0.8% | -0.7% | 0.99 | 87.5% |
| fixed_60m_w5_p045_c010_030 | Conservative | 56 | $286 | 0.3% | -1.0% | 0.31 | 87.5% |
Data Scope
QQQ2025Stock 1-minute barsAlpaca option 1-minute trade bars0DTE credit spreads
The primary stock cache lacks 9:00-9:29 premarket bars, so the 30-minute test is 9:30-10:00 New York time. The real option validation uses historical option trade bars, not historical bid/ask quotes.
Prediction Evaluation
| Minutes | Model | Obs | Base Rate | AUC | Accuracy | Brier |
|---|---|---|---|---|---|---|
| 30 | call_level_break | 139 | 27.3% | 0.747 | 64.0% | 0.217 |
| 30 | put_level_break | 163 | 19.0% | 0.665 | 52.8% | 0.255 |
| 30 | raw_early_return_direction | 239 | 54.0% | n/a | 70.7% | n/a |
| 60 | call_level_break | 141 | 27.0% | 0.773 | 67.4% | 0.206 |
| 60 | put_level_break | 159 | 12.6% | 0.676 | 68.6% | 0.213 |
| 60 | raw_early_return_direction | 239 | 54.0% | n/a | 75.3% | n/a |
| 120 | call_level_break | 139 | 24.5% | 0.805 | 65.5% | 0.197 |
| 120 | put_level_break | 160 | 11.2% | 0.768 | 61.3% | 0.216 |
| 120 | raw_early_return_direction | 239 | 54.0% | n/a | 77.8% | n/a |
Direct Vertical Rules
| Minutes | Side | Width | Trades | Win Rate | Total PnL/Lot | Avg PnL/Lot | Debit Norm |
|---|---|---|---|---|---|---|---|
| 30 | call | 1.000 | 20 | 20.0% | $-195 | $-10 | 29.5% |
| 120 | put | 1.000 | 36 | 22.2% | $-228 | $-6 | 27.6% |
| 120 | call | 1.000 | 19 | 21.1% | $-234 | $-12 | 30.9% |
| 30 | put | 1.000 | 35 | 20.0% | $-325 | $-9 | 28.0% |
| 60 | call | 1.000 | 15 | 6.7% | $-344 | $-23 | 30.7% |
| 60 | put | 1.000 | 15 | 6.7% | $-346 | $-23 | 28.4% |
| 120 | put | 2.000 | 44 | 22.7% | $-562 | $-13 | 26.3% |
| 60 | call | 2.000 | 28 | 25.0% | $-613 | $-22 | 29.8% |
| 30 | put | 2.000 | 50 | 22.0% | $-707 | $-14 | 26.9% |
| 30 | call | 2.000 | 36 | 25.0% | $-754 | $-21 | 29.4% |
| 120 | call | 2.000 | 33 | 21.2% | $-763 | $-23 | 29.3% |
| 60 | put | 2.000 | 25 | 4.0% | $-1,392 | $-56 | 29.2% |
| 120 | put | 5.000 | 40 | 22.5% | $-2,337 | $-58 | 22.5% |
| 60 | put | 5.000 | 35 | 14.3% | $-2,427 | $-69 | 24.1% |
| 30 | call | 5.000 | 52 | 23.1% | $-2,751 | $-53 | 25.0% |
| 60 | call | 5.000 | 50 | 22.0% | $-2,875 | $-57 | 25.3% |
| 120 | call | 5.000 | 46 | 19.6% | $-2,882 | $-63 | 24.6% |
| 30 | put | 5.000 | 59 | 23.7% | $-3,098 | $-53 | 24.4% |
Exploratory Rule Sweep
| Minutes | Side | Width | Min Prob | Debit Min | Debit Max | Trades | Win Rate | Total PnL/Lot | Avg PnL/Lot |
|---|---|---|---|---|---|---|---|---|---|
| 30 | call | 2.000 | 0.550 | 0.350 | 0.650 | 29 | 55.2% | $492 | $17 |
| 30 | call | 2.000 | 0.550 | 0.350 | 0.650 | 29 | 55.2% | $492 | $17 |
| 30 | call | 2.000 | 0.550 | 0.350 | 0.650 | 29 | 55.2% | $492 | $17 |
| 30 | call | 2.000 | 0.500 | 0.350 | 0.650 | 30 | 53.3% | $416 | $14 |
| 30 | call | 2.000 | 0.500 | 0.350 | 0.650 | 30 | 53.3% | $416 | $14 |
| 30 | call | 2.000 | 0.500 | 0.350 | 0.650 | 30 | 53.3% | $416 | $14 |
| 30 | call | 1.000 | 0.550 | 0.350 | 0.650 | 45 | 51.1% | $348 | $8 |
| 30 | call | 1.000 | 0.550 | 0.350 | 0.650 | 45 | 51.1% | $348 | $8 |
| 30 | call | 1.000 | 0.550 | 0.350 | 0.650 | 45 | 51.1% | $348 | $8 |
| 30 | call | 1.000 | 0.500 | 0.350 | 0.650 | 46 | 50.0% | $307 | $7 |
| 30 | call | 1.000 | 0.500 | 0.350 | 0.650 | 46 | 50.0% | $307 | $7 |
| 30 | call | 1.000 | 0.500 | 0.350 | 0.650 | 46 | 50.0% | $307 | $7 |
| 30 | call | 2.000 | 0.500 | 0.350 | 0.650 | 17 | 52.9% | $243 | $14 |
| 30 | call | 2.000 | 0.550 | 0.350 | 0.650 | 17 | 52.9% | $243 | $14 |
| 30 | call | 2.000 | 0.600 | 0.350 | 0.650 | 17 | 52.9% | $243 | $14 |
| 30 | call | 2.000 | 0.650 | 0.350 | 0.650 | 17 | 52.9% | $243 | $14 |
| 30 | call | 2.000 | 0.700 | 0.350 | 0.650 | 16 | 50.0% | $224 | $14 |
| 30 | call | 2.000 | 0.700 | 0.350 | 0.650 | 16 | 50.0% | $224 | $14 |
| 30 | call | 2.000 | 0.700 | 0.350 | 0.650 | 16 | 50.0% | $224 | $14 |
| 30 | call | 2.000 | 0.700 | 0.350 | 0.650 | 16 | 50.0% | $224 | $14 |
Close Decay Check
For the top exploratory pocket, the test marks the same 30-minute $2-wide call debit spread at several exit times. The actual path improves near the close, but the frozen-spot test shows that pure time decay is negative for this long debit spread.
| Exit Min | Trades | Win Rate | Total PnL/Lot | Avg PnL/Lot | Exit Norm | Frozen Spot PnL |
|---|---|---|---|---|---|---|
| 60.000 | 29.000 | 58.6% | $51 | $2 | 41.7% | $-1 |
| 120.000 | 29.000 | 48.3% | $-58 | $-2 | 39.8% | $-3 |
| 180.000 | 29.000 | 69.0% | $200 | $7 | 44.2% | $-5 |
| 240.000 | 29.000 | 65.5% | $253 | $9 | 45.2% | $-10 |
| 300.000 | 29.000 | 58.6% | $236 | $8 | 44.9% | $-17 |
| 360.000 | 29.000 | 55.2% | $183 | $6 | 44.0% | $-36 |
| 380.000 | 29.000 | 58.6% | $374 | $13 | 47.3% | $-56 |
| 390.000 | 29.000 | 55.2% | $492 | $17 | 49.3% | $-80 |
Real Option Bar Validation
This re-runs the credit-spread tests with Alpaca historical QQQ 0DTE option minute trade bars for entry marks, then intrinsic settlement at the close. This is closer to reality than Black-Scholes, but still not a bid/ask quote simulation.
| Sample | Requested | Validated | Coverage | Real Win | Avg/Lot | Portfolio PnL | Conservative PnL |
|---|---|---|---|---|---|---|---|
| split_test | 10 | 10 | 100.0% | 100.0% | $47 | $944 | $847 |
| fixed_60m_w5_p045_c010_030 | 57 | 56 | 98.2% | 87.5% | $8 | $844 | $286 |